
Page 16 - SAP Universal Allocation
P. 16
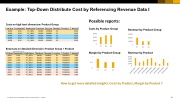
  Example: Top-Down Distribute Cost by Referencing Revenue Data I
Costs on high level dimension: Product Group
Possible reports: Costs by Product Group
                                  6000
                                  4000
                                  2000
0
01 02 03
Margin by Product Group
1 0.5 0
01 02 03
How to get more detailed insights: Costs by Product, Margin by Product ?
  CO Area
 CompCode
ProfitCenter
 BusArea
  Account
  ProdGrp
Product
  Amount
 A000 1010
 PC_0001 BA001
 400000
400001
01   3000
 A000 1010
 PC_0001 BA001
01   1000
 A000 1010
 PC_0001 BA001
 400001
400002
02   2000
 A000 1010
 PC_0001 BA001
02   3000
 A000 1010
 PC_0001 BA001
 400003
03   5000
           Revenues on detailed dimension: Product Group + Product
Revenue by Product Group
30000
20000
10000
0
01 02 03
Revenue by Product
8000 6000 4000 2000
0
  CO Area
  CompCode
ProfitCenter
 BusArea
 Account
   ProdGrp
 Product
   Amount
 A000 1010
 PC_0001 BA001 800000
 01 PROD001
 7000
 A000 1010
 PC_0001 BA001 800000
 01 PROD002
 3000
 A000 1010
 PC_0001 BA001 800000
 01 PROD003
 4000 6000
 A000 1010
 PC_0001 BA001 800000
 01 PROD004
 A000 1010
 PC_0001 BA001 800000
 02 PROD005
 7000
 A000 1010
 PC_0001 BA001 800000
 02 PROD006
 3000
 A000 1010
 PC_0001 BA001 800000
 03 PROD007
 1500 6000
 A000 1010
 PC_0001 BA001 800000
 03 PROD008
 A000 1010
 PC_0001 BA001 800000
 03 PROD009
 2500
             © 2018 SAP SE or an SAP affiliate company. All rights reserved. ǀ PUBLIC
16
